
Page 43 - D Red Select Sale – Dec. 8, 2018 North Dakota Red Angus Female Sale.
P. 43
Multi-breed Genetic Evaluation powered by BOLT
Are the New BOLT-Derived EPDs More Accurate Than Previous Cornell EPDs?
By Mahdi Saatchi, Rohan L. Fernando, Lauren Hyde, Jackie Atkins, Steve McGuire,
Wade Shafer, Matt L. Spangler, and Bruce Golden, IGS Genetic Evaluation Team and Consultants.
The ASA and International Genetic Solution animal’s genome (or genes) play more important
(IGS) partners invested in a new and improved roles than other parts of its genome (or genes).
genetic evaluation software called BOLT to replace This is unique to the IGS Single-step method com-
the Cornell EPD evaluation system. Among other pared to other organizations where the DNA
benefits, this enables the use of Single-step methods marker information is used to adjust relationships
for incorporating genomic information into the among the individuals.
National Cattle Evaluation instead of the blending Are the BOLT EPDs more accurate than the
approach. In the Single-step process, the DNA Cornell derived EPDs in the real world? To answer
marker genotypes are directly incorporated into the this question, we performed a validation study
genetic evaluation along with the phenotypes where we ran a data set (pedigree, performance,
(performance data) and the pedigree. As a result, genomics) through both genetic evaluation
the genomic data has an impact not only on the software (BOLT and Cornell) to compare the accura-
genotyped individual, but also on all the relatives of cies of the EPDs produced. To enable a fair
that genotyped individual. This allows for the comparison, we removed the performance records
genomic information to improve the accuracy of of animals born in 2015 and later from the evalua-
non-genotyped relatives. tion in both systems to be used as progeny
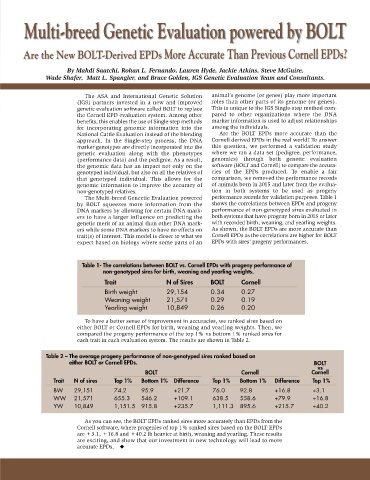
The Multi-breed Genectic Evaluation powered performance records for validation purposes. Table 1
by BOLT squeezes more information from the shows the correlations between EPDs and progeny
DNA markers by allowing for certain DNA mark- performance of non-genotyped sires evaluated in
ers to have a larger influence on predicting the both systems that have progeny born in 2015 or later
genetic merit of an animal than other DNA mark- with recorded birth, weaning, and yearling weights.
ers while some DNA markers to have no effects on As shown, the BOLT EPDs are more accurate than
trait(s) of interest. This model is closer to what we Cornell EPDs as the correlations are higher for BOLT
expect based on biology where some parts of an EPDs with sires’ progeny performances.
Table 1- The correlations between BOLT vs. Cornell EPDs with progeny performance of
non-genotyped sires for birth, weaning and yearling weights.
Trait N of Sires BOLT Cornell
Birth weight 29,154 0.34 0.27
Weaning weight 21,571 0.29 0.19
Yearling weight 10,849 0.26 0.20
To have a better sense of improvement in accuracies, we ranked sires based on
either BOLT or Cornell EPDs for birth, weaning and yearling weights. Then, we
compared the progeny performance of the top 1% vs bottom 1% ranked sires for
each trait in each evaluation system. The results are shown in Table 2.
Table 2 – The average progeny performance of non-genotyped sires ranked based on
either BOLT or Cornell EPDs. BOLT
vs
BOLT Cornell Cornell
Trait N of sires Top 1% Bottom 1% Difference Top 1% Bottom 1% Difference Top 1%
BW 29,151 74.2 95.9 +21.7 76.0 92.8 +16.8 +3.1
WW 21,571 655.3 546.2 +109.1 638.5 558.6 +79.9 +16.8
YW 10,849 1,151.5 915.8 +235.7 1,111.3 895.6 +215.7 +40.2
As you can see, the BOLT EPDs ranked sires more accurately than EPDs from the
Cornell software, where progenies of top 1% ranked sires based on the BOLT EPDs
are +3.1, +16.8 and +40.2 lb heavier at birth, weaning and yearling. These results
are exciting, and show that our investment in new technology will lead to more
accurate EPDs. ◆
Catalog online at ndredangus.com North Dakota Red Select Sale