
Page 5 - Hunt's Brangus Bull Sale
P. 5
2017 Professional Cattlemen’s Bull Sale – Cattle with Something EXTRA!
Bulls designated with the “Calving-ease Flag” are felt to be Low-
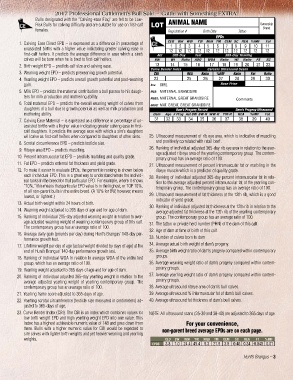
Risk Bulls for calving diffi culty and are suitable for use on fi rst-calf LOT ANIMAL NAME Ownership
females. Registration # Birth Date Tattoo Brand
EPDs
1. Calving Ease Direct EPD – is expressed as a difference in percentage of CED BW WW YW Milk TM CEM SC REA %IMF Fat
6
8
7
5
2
1
4
3
9
11
10
unassisted births with a higher value indictating greater calving ease in 12 12 12 12 12 12 12 12 12 12 12
fi rst-calf heifers. It predicts the average difference in ease which a sire’s Act 205-Day Test 365-Day Yearling
calves will be born when he is bred to fi rst-calf heifers. BW Wt Ratio ADG WDA Ratio Wt Ratio FS SC
2. Birth weight EPD – predicts calf size and calving ease. 13 14 15 16 17 18 19 20 21 22
Curve Bender Index Carcass Ultrasound Scans
3. Weaning weight EPD – predicts preweaning growth potential. CBI REA Ratio %IMF Ratio Fat Ratio
4. Yearling weight EPD – predicts overall growth potential and post-weaning 23 25 26 27 28 29 30
gain. Sire: SIRE Base Price
5. Milk EPD – predicts the maternal contribution a bull passes to his daugh- MGS: MATERNAL GRANDSIRE
ters for milk production and mothering ability. MGGS: MATERNAL GREAT GRANDSIRE
6. Total maternal EPD – predicts the overall weaning weight of calves from GGGS: MAT. GREAT, GREAT GRANDSIRE Comments
daughters of a bull due to growth potential as well as milk production and Dam’s Progeny Record Dam’s Progeny Ultrasound
mothering ability. Dam Age # Prog Act BW BW-R WW-R YW-R REA %IMF Fat
7. Calving Ease Maternal – is expressed as a difference in percentage of un- 31 32 33 34 35 36 37 38 39 40
assisted births with a higher value indicating greater calving ease in fi rst-
calf daughters. It predicts the average ease with which a sire’s daughters
will calve as fi rst-calf heifers when compared to daughters of other sires. 25. Ultrasound measurement of rib eye area, which is indicative of muscling
8. Scrotal circumference EPD – predicts testicle size. and positively correlated with retail beef .
9. Ribeye area EPD – predicts muscling. 26. Ranking of individual adjusted 365-day rib eye area in relation to the aver-
age adjusted rib eye area of the yearling contemporary group. The contem-
10. Percent intramuscular fat EPD – predicts marbling and quality grade. porary group has an average ratio of 100.
11. Fat EPD – predicts external fat thickness and yield grade. 27. Ultrasound measurement of percent intramuscular fat or marbling in the
12. To make it easier to evaluate EPDs, the percentile ranking is shown below ribeye muscle which is a predictor of quality grade.
each individual EPD. This is a great way to understand where the individ- 28. Ranking of individual adjusted 365-day percent intramuscular fat in rela-
ual ranks in the breed for that particular EPD. For example, where it shows tion to the average adjusted percent intramuscular fat of the yearling con-
“10%,” this means that particular EPD value is in the highest, or TOP 10%, temporary group. The contemporary group has an average ratio of 100.
of all non-parent bulls in the entire breed. (A 10% for BW, however, means
lowest, or lightest.) 29. Ultrasound measurement of fat thickness at the 12th rib, which is a good
indicator of yield grade.
13. Actual birth weight within 24 hours of birth. 30. Ranking of individual adjusted fat thickness at the 12th rib in relation to the
14. Weaning weight adjusted to 205 days of age and for age of dam. average adjusted fat thickness at the 12th rib of the yearling contemporary
15. Ranking of individual 205-day adjusted weaning weight in relation to aver- group. The contemporary group has an average ratio of 100.
age adjusted weaning weight of weaning contemporary group of this calf. 31. The tattoo or private herd number (PHN) of the dam of this calf.
The contemporary group has an average ratio of 100.
16. Average daily gain (pounds per day) during Hunt’s Brangus’ 140-day per- 32. Age of dam at time of birth of this calf.
formance growth test. 33. Number of calves born to dam
17. Lifetime weight per day of age (actual weight divided by days of age) at the 34. Average actual birth weight of dam’s progeny.
end of Hunt’s Brangus’ 140-day performance growth test. 35. Average birth weight ratio of dam’s progeny compared within contemporary
18. Ranking of individual WDA in relation to average WDA of the entire test groups.
group, which has an average ratio of 100. 36. Average weaning weight ratio of dam’s progeny compared within contem-
19. Yearling weight adjusted to 365 days of age and for age of dam. porary groups.
20. Ranking of individual adjusted 365-day yearling weight in relation to the 37. Average yearling weight ratio of dam’s progeny compared within contem-
average adjusted yearling weight of yearling contemporary group. The porary groups.
contemporary group has an average ratio of 100. 38. Average ultrasound ribeye area of dam’s bull calves.
21. Yearling frame score adjusted to 365-days of age. 39. Average ultrasound % intermuscular fat of dam’s bull calves.
22. Yearling scrotal circumference (testicle size measured in centimeters) ad- 40. Average ultrasound fat thickness of dam’s bull calves.
justed to 365-days of age.
23. Curve Bender Index (CBI). The CBI is an index which combines values for NOTE: All ultrasound scans (25-30 and 38-40) are adjusted to 365 days of age.
low birth weight EPD and high yearling weight EPD into one value. This
Index has a highest achievable numeric value of 148 and goes down from For your convenience,
there. Bulls with a higher numeric value for CBI would be expected to non-parent breed average EPDs are on each page.
sire calves with lighter birth weights and yet heavier weaning and yearling
weights. CED BW WW YW MILK TM CEM SC REA FT %IMF
EPDS 3.8 1.0 24.4 45.4 9.3 21.5 3.8 0.46 0.34 -0.040 0.01
Hunt’s Brangus – 3